

AI Analysis
The Ulugo desktop app analyzes games locally and displays top moves, territory, score, and win-rate changes. AI analysis is not available in the web app.
Ulugo prepares the AI runtime automatically on first use. See Runtime and Hardware Setup for configuration details.
Start Analysis
After opening a game record, click the lightning button at the bottom-right of the board or press Space:
- Ulugo first scans the existing moves at low visits to build the full-game charts;
- Analysis then continues on the current position, and the result stabilizes as the search progresses;
- Completed nodes are cached and do not need to be analyzed again when revisited;
- Press
Spaceagain to stop analysis.
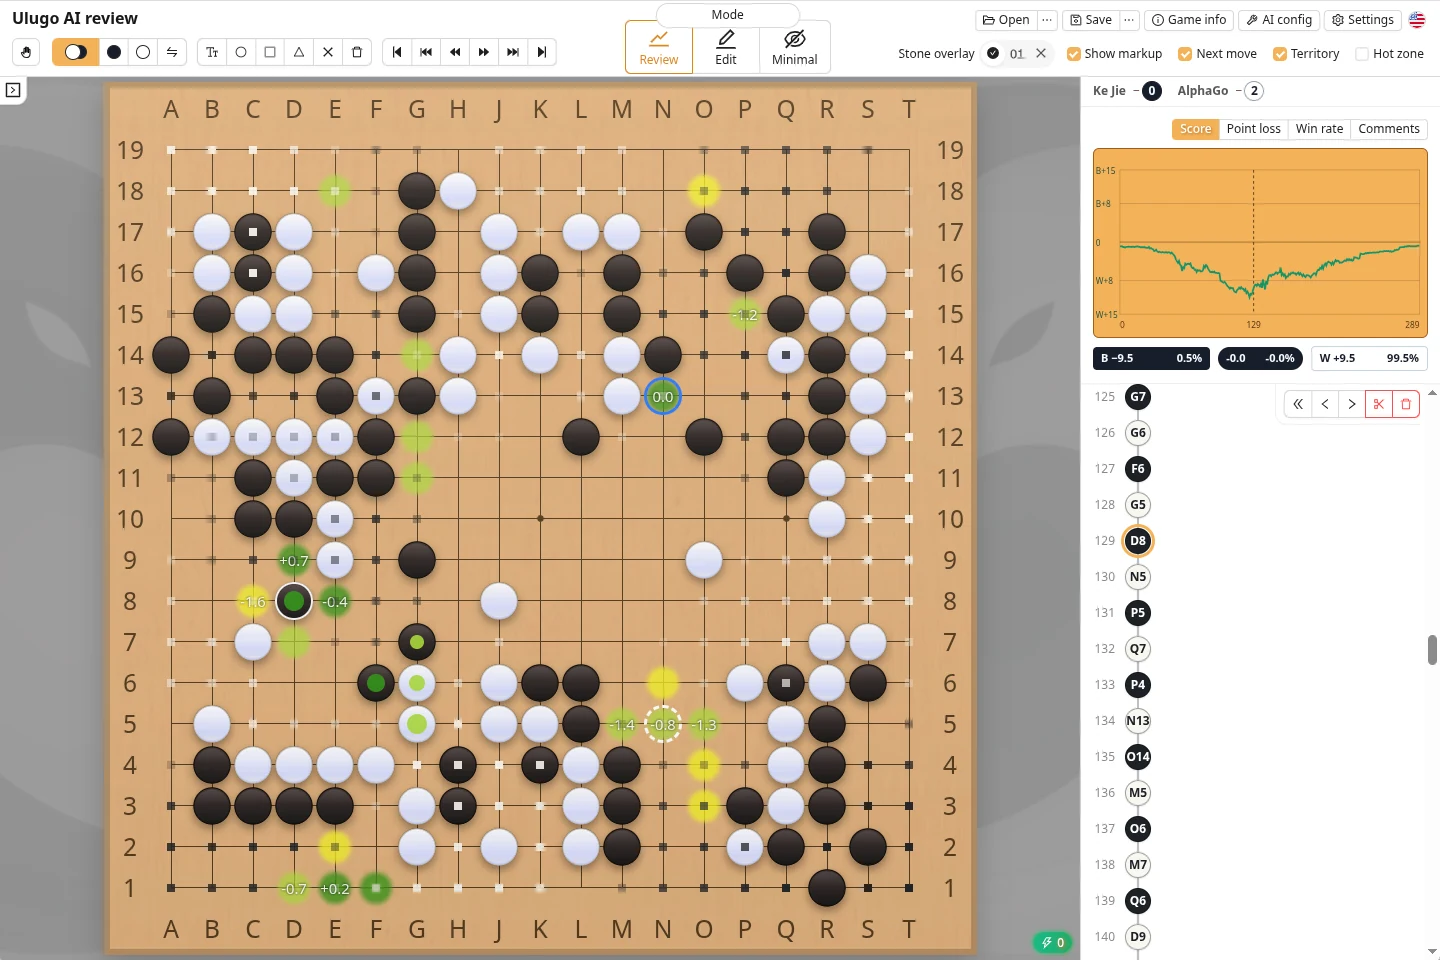
Hold Shift while clicking the analysis button, or press Shift + Space, to start Deep analysis. It continues searching the current position and is useful for comparing complex variations.
Top Moves
Top moves are candidate moves from the current search. The circles show their order; Top move overlay in Settings can also display the following values:
| Option | Description |
|---|---|
| Score change | Estimated score change relative to the best candidate. 0 is the baseline; -3.0 means a loss of about 3 points |
| Win-rate change | Win-rate change relative to the best candidate. 0% is the baseline; negative values indicate a loss in win rate |
| Score | Estimated final score after the move, from the current player's perspective; positive means ahead and negative means behind |
| Visits | Search visits allocated to the candidate, reflecting search allocation and result stability rather than move quality alone |
| Value | The value of the move relative to passing. It is similar to, but not identical to, gote endgame value |
Top move overlay can show up to two values at once. Minimal visit to show top move overlay hides candidates whose search is still too limited for stable values.
Press Enter to play the current best move. See Shortcuts and Gestures for more controls.
Principal Variation
Hover over a top move to preview the AI's expected continuation on the board. Alt-clicking a top move shows the same preview.
Principal variation preview delay controls how long you must hover before the sequence appears. Setting it to 0 disables hover previews but does not disable Alt-click.
The principal variation is the main line from the current search, not the only possible continuation. It may change as the search continues.
Charts
The right panel provides four charts, which can be displayed separately or together:
| Chart | Description |
|---|---|
| Score | Estimated final score after each move, including komi and the current rules. The area above the center line is B+; below it is W+ |
| Point loss | Estimated score lost by the played move. Taller bars indicate larger losses; changes above about 1 point are highlighted |
| Win rate | Black's estimated win rate after each move. White's win rate is 100% − Black's win rate, with 50% as the even-game baseline |
| Intensity | Current fighting intensity, measured by the score lost if the current player passes instead of playing the best move. The shaded area extends equally above and below zero |
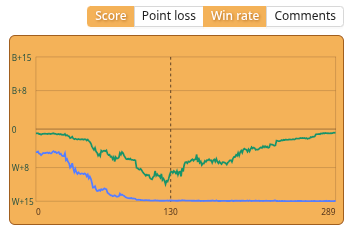
Hover over a chart to view the move number, score, both players' win rates, and point loss. Click to jump directly to that move, or use the mouse wheel over the chart to move backward and forward.
In a game with a large lead, win rate may stay close to 0% or 100% for a long time. Score and point loss are usually more informative for comparing individual moves in that situation.
The intensity display limit defaults to 25. The axis expands only as the actual intensity rises, up to this limit. If the score or point-loss chart already needs a wider axis, intensity may use that wider range, but intensity alone never expands it further.
Territory and Hot Zone
| Display | Description |
|---|---|
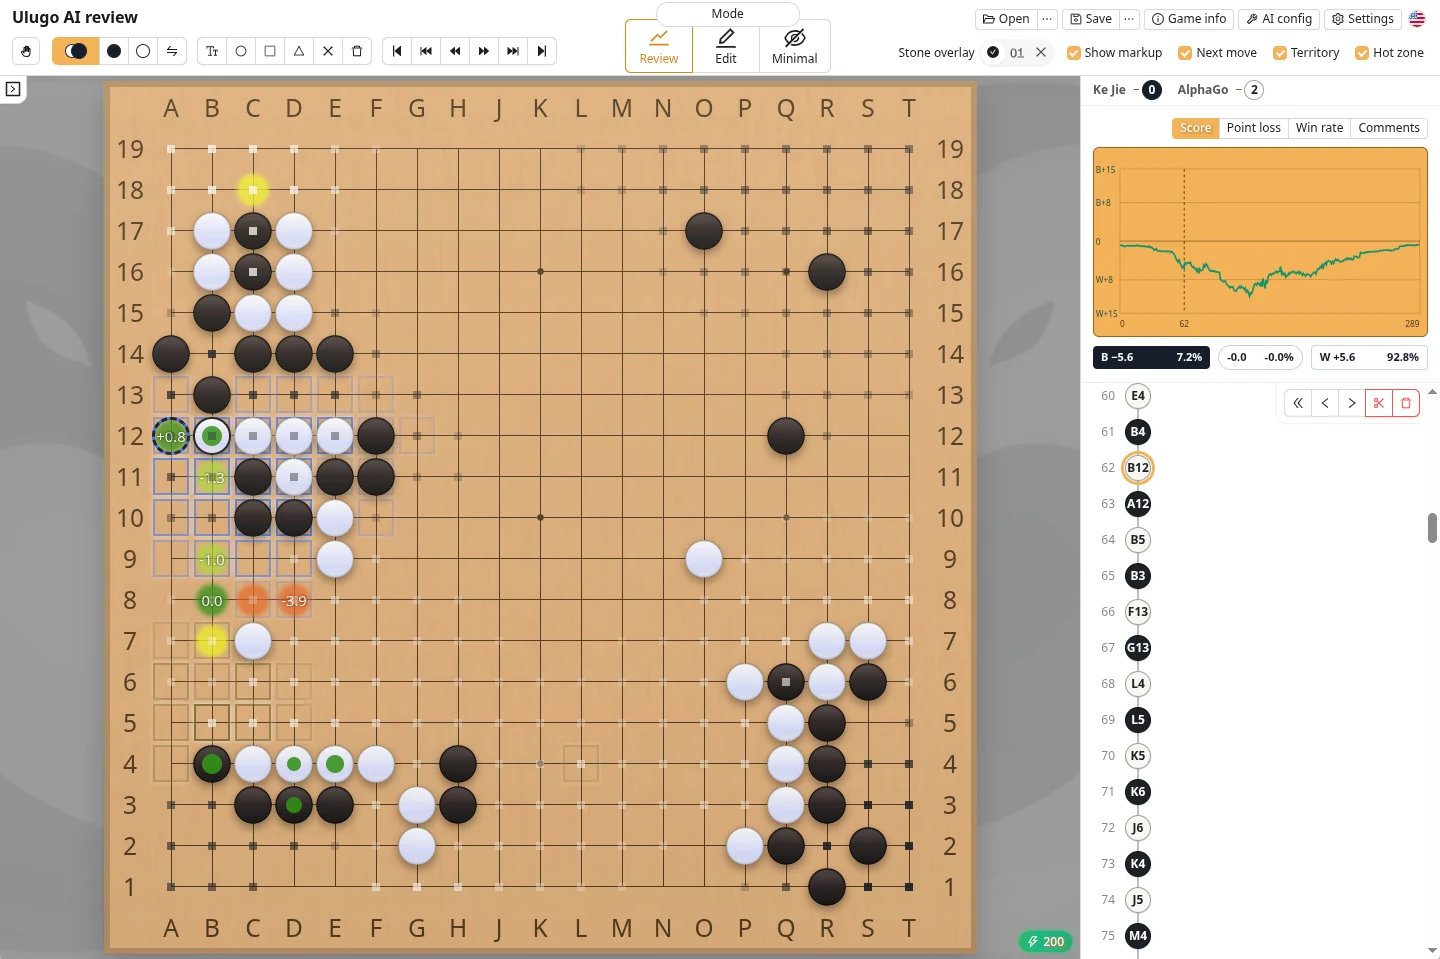
| Territory | Semi-transparent colors show the areas each side is expected to control. This is the current analysis estimate, not a confirmed final score |
| Hot zone | Blue marks key areas contested by both sides or vulnerable after a mistake. Gray marks areas that may need to be sacrificed to preserve something more important |
If Analysis Is Slow
First try reducing the visits used for normal analysis or the full-game scan. For models, hardware, and runtime settings, see Runtime and Hardware Setup.